26 Feb 2015
By Belle

Filling up your productivity graph
If you connect your RescueTime account to Exist, you'll see a circle graph on your dashboard like this one:
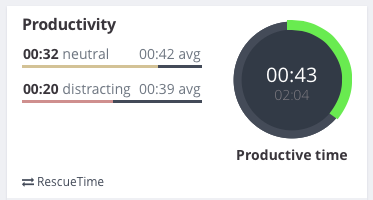
The graph fills up as you add more productive time over the day. These days filling up my productivity graph is analogous to getting things done.
Productivity goals
In RescueTime you can set a goal for your productive time:
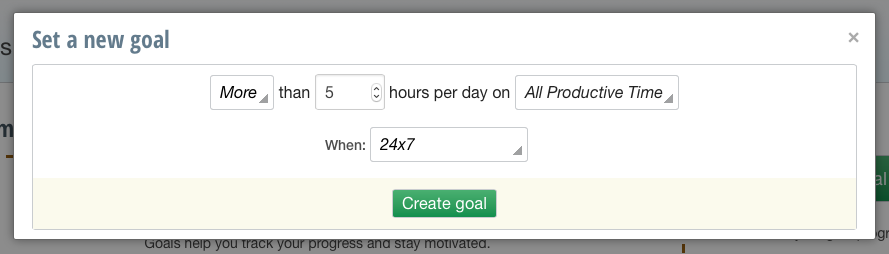
In Exist, rather than taking your goal from RescueTime we set one for you. Initially we use a placeholder goal of two hours until we have enough data to work with.
Once we've collected enough data, we determine your goal dynamically each day. Today is Thursday, so my productivity goal is an average of the productive time I tracked for each Thursday in the past 90 days. Tomorrow my goal will come from an average of all the Fridays in the past 90 days.
Using averages as goals means your goal is tailored to you, and because it's based on the past 90 days, it always reflects what you've been doing lately, rather than long-term habits. I recently started an acting course that runs all day on Saturdays, so my productivity tracked with RescueTime has dropped to almost nothing on Saturdays; my last three saturdays included 33 minutes, 30 minutes, and 0 minutes of productive time.
After a few weeks of this, my 90-day average will come into line with my new habits and I'll have a very small goal to hit for productive time on Saturdays.
Categorising time
If you've been using RescueTime for a while you'll know that getting it to run smoothly requires some effort from the user to categorise your time properly. Each website or app that you use can be classified into a category and ranked on a scale from very distracting to very productive.
Getting this right is imperative for accurate tracking. One thing I've missed in the past is that some browsers won't send the name of each website to RescueTime unless you install a browser extension. I've had a few days where the majority of my time was classified as neutral because I switched to a browser that needed the extension without realising it was necessary.
You can download the browser extensions for Chrome and Firefox from RescueTime.
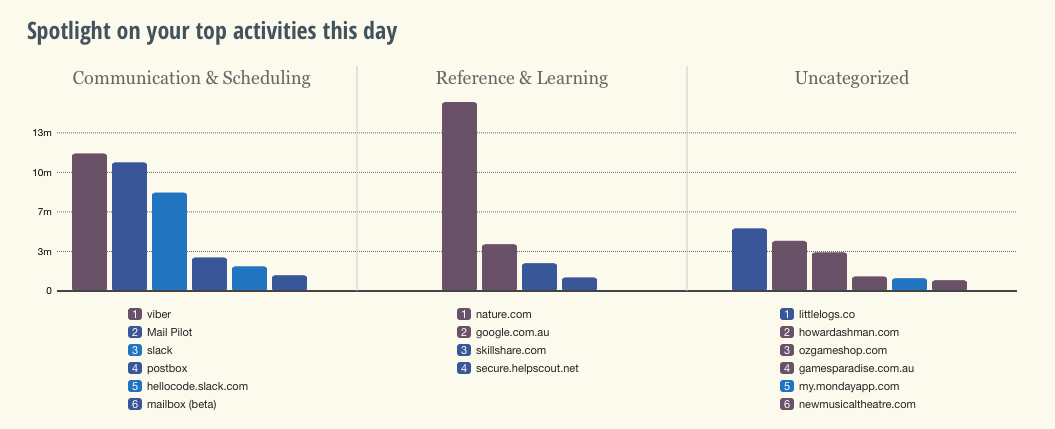
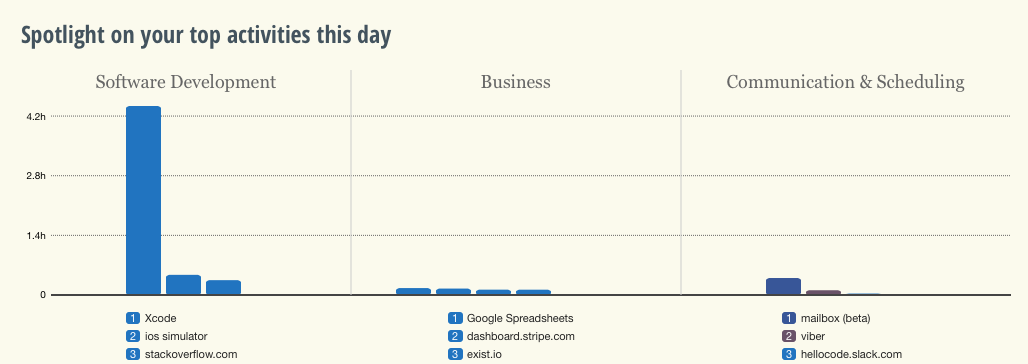
I've also had to put in some effort to categorise apps or websites I visit often to make sure I'm getting all the credit I deserve for productive activities. Here are my top activities and their categories from today, Thursday Feb 26th:
And here are some of my most commonly used apps and sites overall:
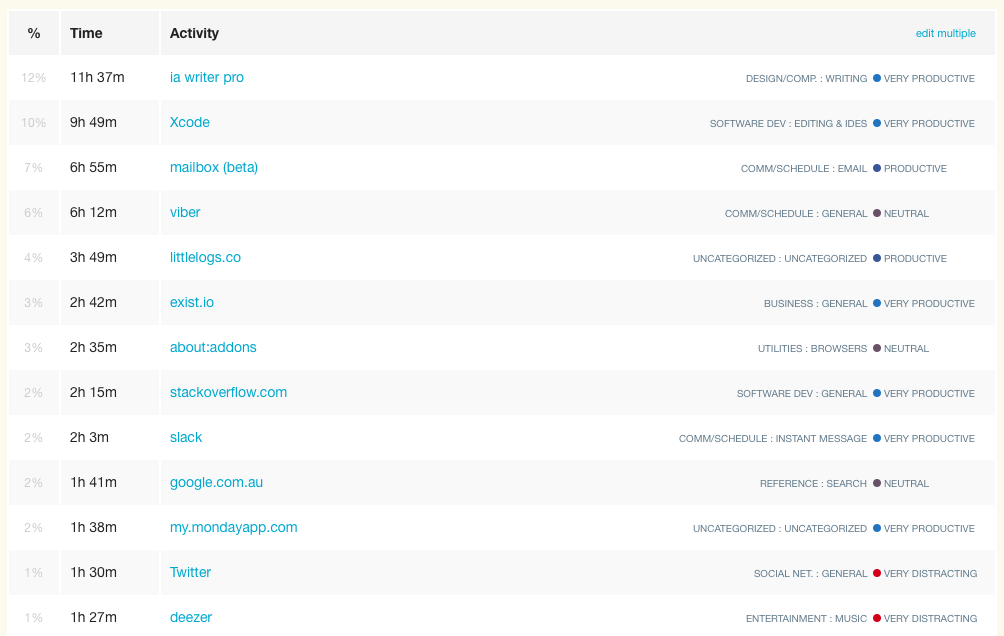
The Exist productivity graph includes both productive and very productive time from your RescueTime account. I tend to classify my email and communication apps (like Viber) as neutral, since they can sometimes be very productive but they can also be big time wasters.
I'm really happy to see that Xcode and iA Writer Pro are my top-used apps, since they're also the facilitators of my most productive and important work.
What it takes to have a productive day
I'm constantly curious about what makes a day productive for me, and what holds me back from getting work done. I'm hoping that finding out what makes me more productive will let me restructure my days so I can fill up that productivity graph more often.
Looking back over my recent data, I can see a few outliers when I was far more productive than usual:

The really funny part about those days is how predictable they are. On each of those big outliers you can see in my Exist graph above, I spent almost all of my time in Xcode. They all look something like this:
Now that I'm using littlelogs to log what I get done every day, I can look through my most and least productive days to see what I actually did. I expect days with logs about coding will be among my most productive.
But yesterday was my most productive day for a week, with no coding involved at all. Here are my logs for the day:
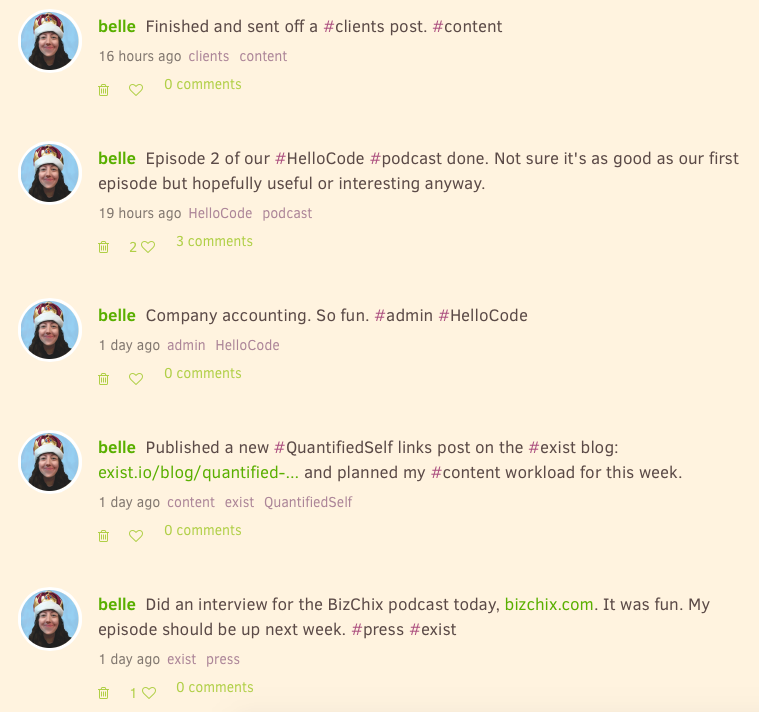
Something I noticed about this day from looking at my logs is that I started strong. The first log was about an interview I did at 8:30am. So by 9:30 I'd already ticked something big off my to do list for the day. I also worked on varied tasks throughout the day, rather than trying to make progress on one big project.
I'm still trying to suss out what makes my most productive days, but I'm starting to pull together the clues to improve each day going forward.
And now that I've finished this post, here's how today's productivity graph is looking:
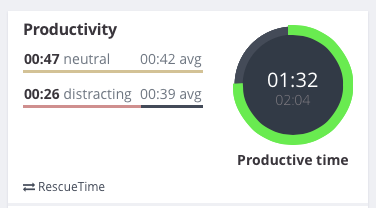
Not long to go to fill that circle up now!
If you'd like to try out Exist, you can sign up for a 14-day free trial. littlelogs is in private beta, but you can sign up for an invite now.