25 Sep 2019
By Belle

Historical browsing in Exist
A few months ago we released an update to the Exist web app that includes some different options for browsing your data from past days, weeks, and months. There are lots of options for exploring your data, so let's look at how it all works.
The dashboard
When you first log in to Exist, you'll land on the dashboard for today.
This view includes today's insights, cards for all of your attributes for today, and a 30-day graph.
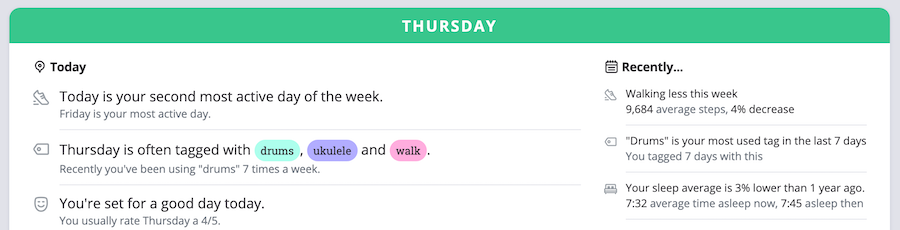
Your insights will change each day, and include information about today's data on the left, and information about longer periods, like the past week or month, on the right:
If you want to see this same dashboard for a day in the past, you can use the left arrow just above the data cards to go to yesterday:
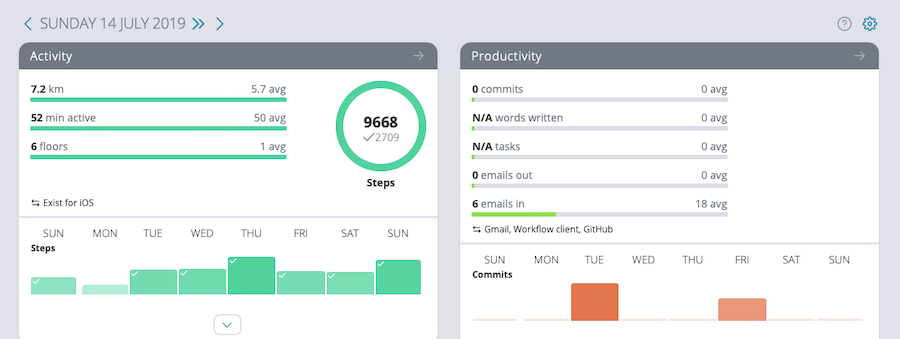
You won't see insights, but your data cards and 30-day graph will update to show data for yesterday. You can keep using the arrows to browse through different days, or click the double arrow to return to today. Or, if you have a particular day in mind, you can simply adjust the URL to visit your dashboard for that day. Dashboard URLs are formatted like so:
https://exist.io/dashboard/2019-7-14/
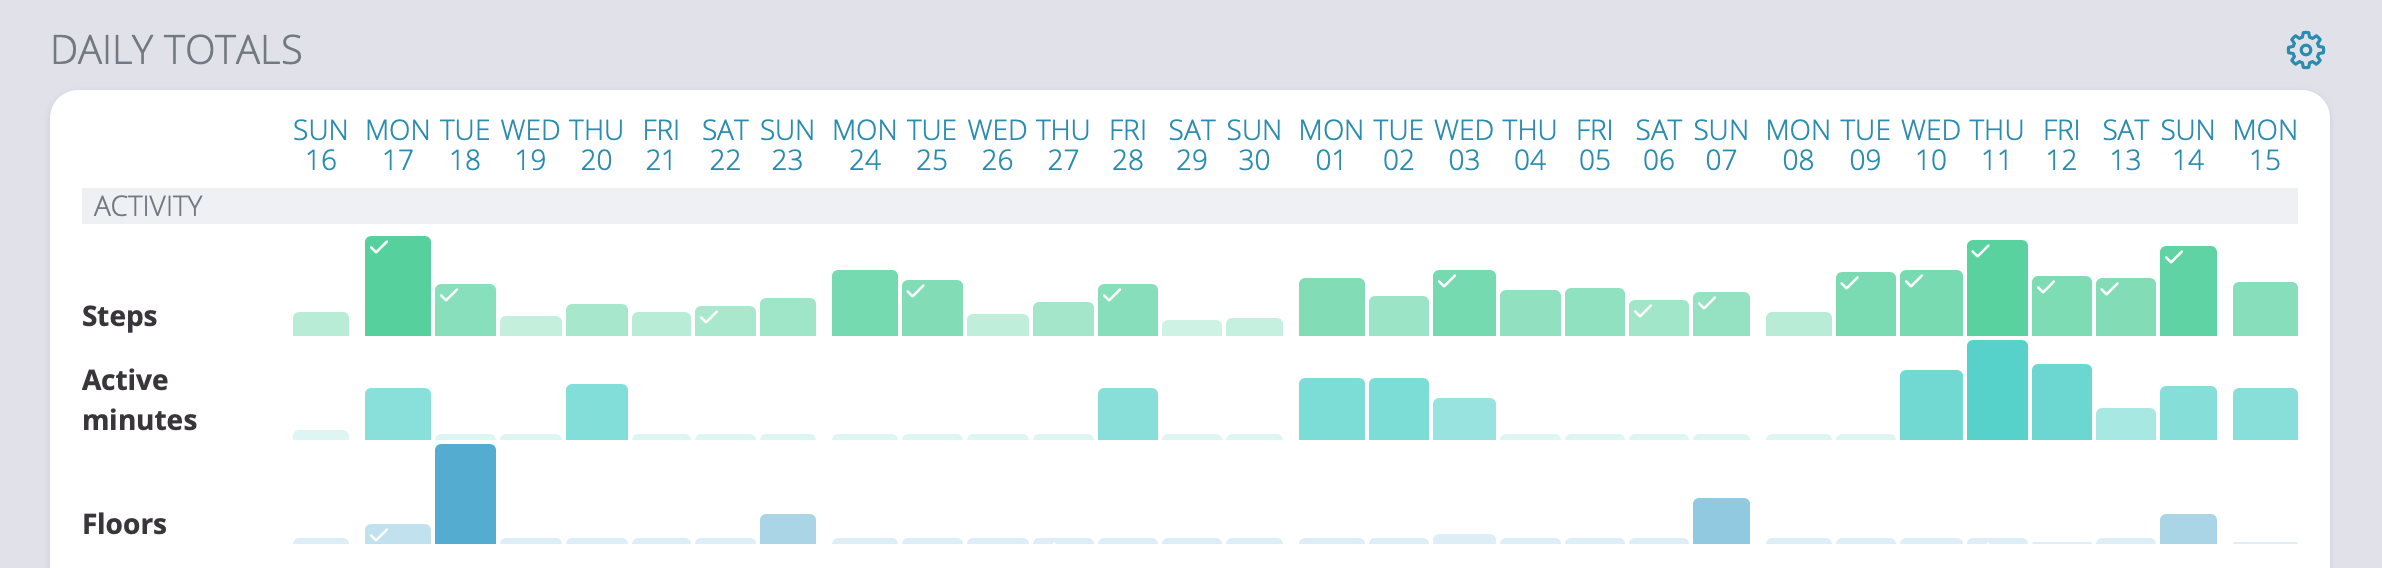
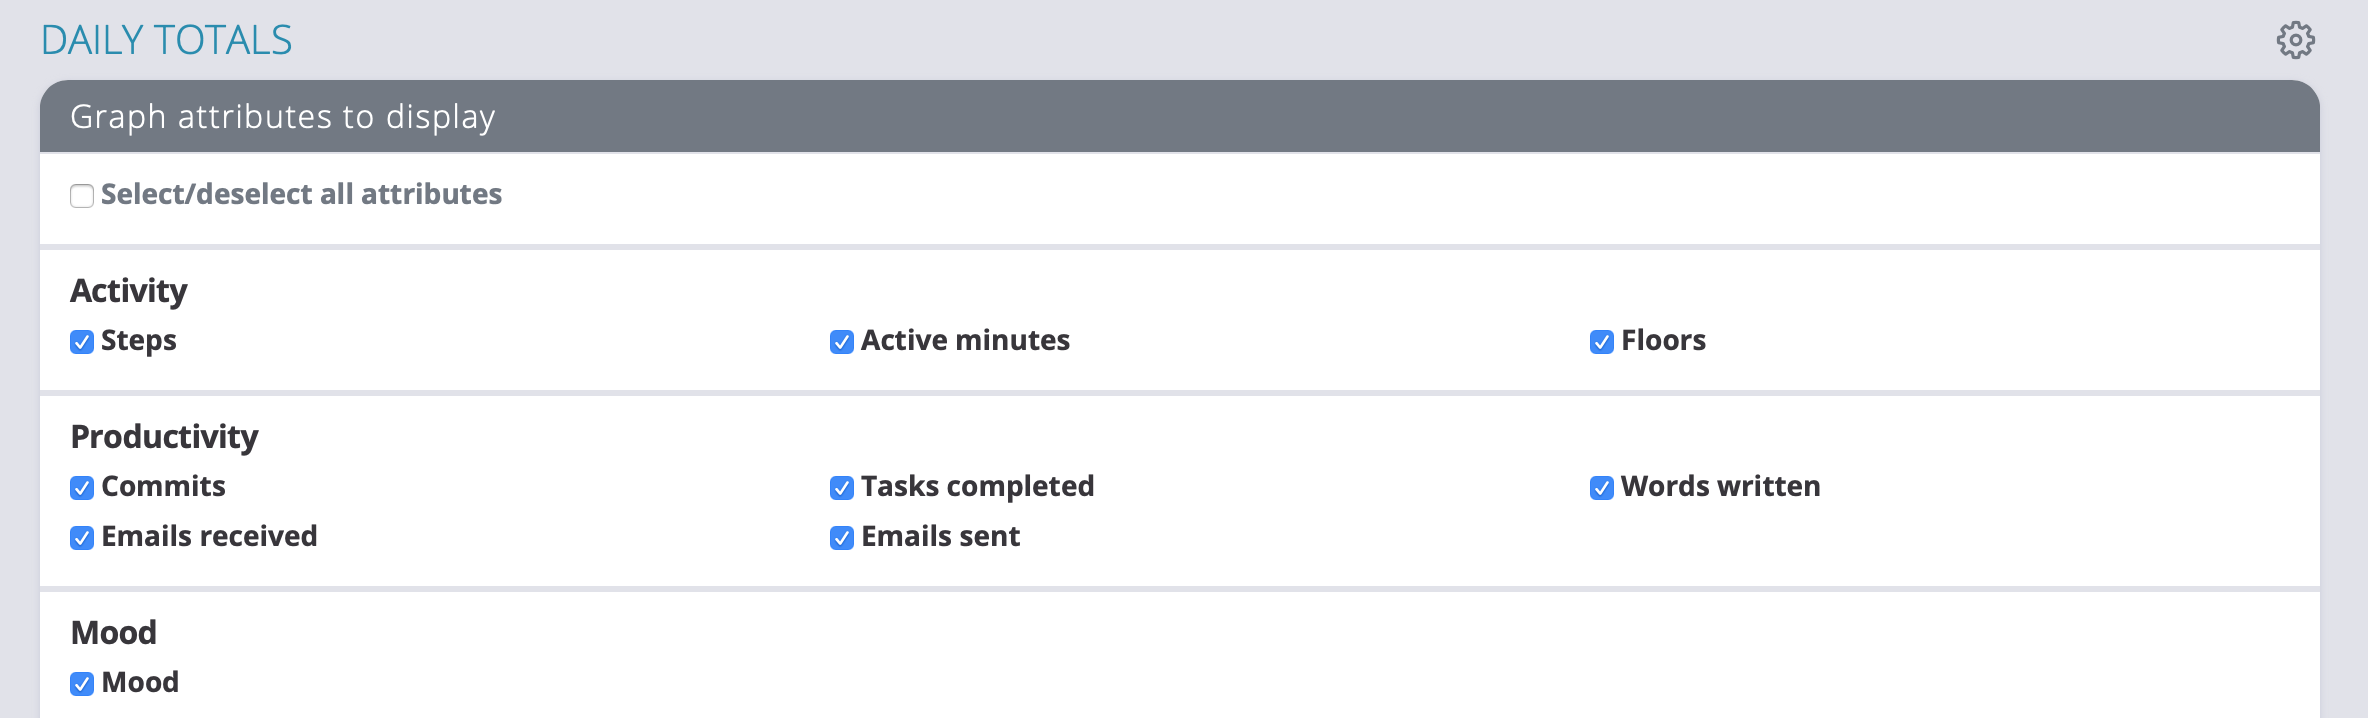
Finally, you can adjust the 30-day graph on your dashboard to hide attributes you don't want to see. Click on the cog icon just above the graph to choose which attributes should show up:
Weekly view
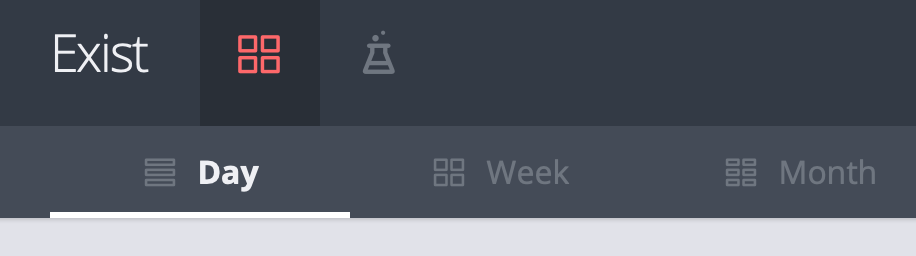
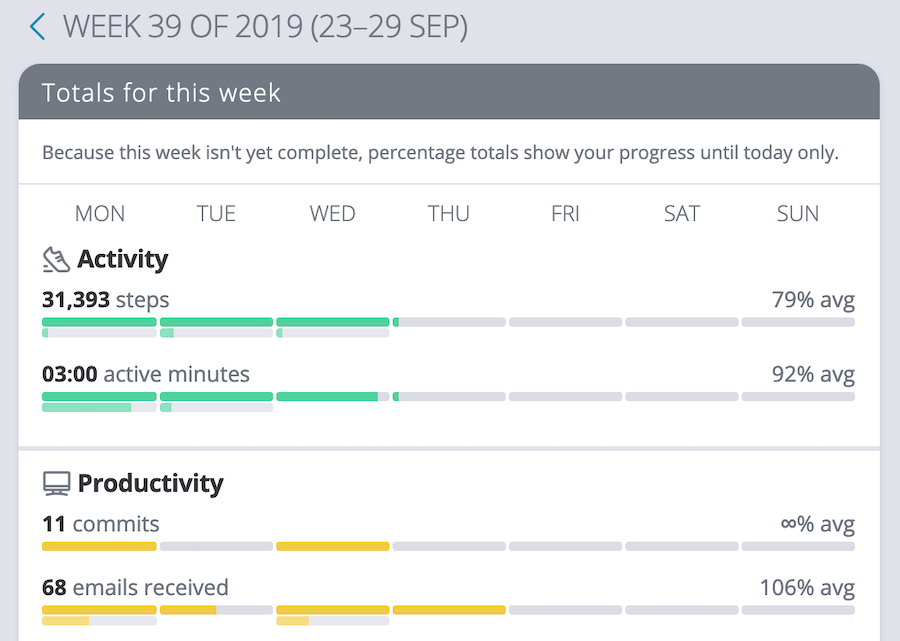
At the top of the dashboard you'll see options for Day, Week, and Month view. The default dashboard is the day view, so click "Week" to visit the weekly view.
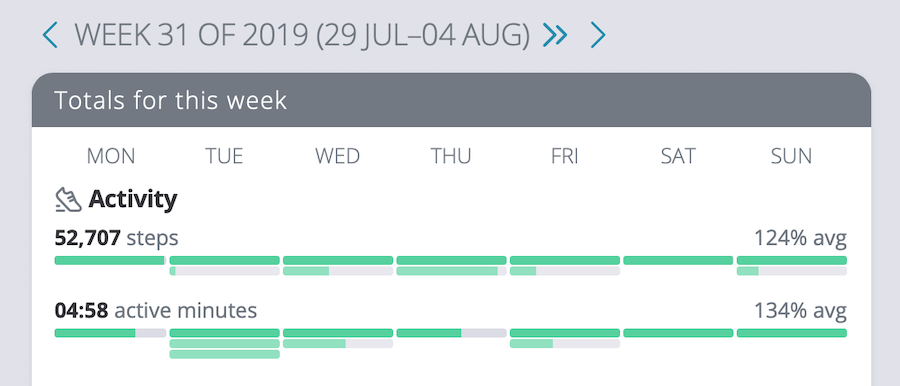
Here you'll see bars for some of your attributes, showing how close to your average you got per day and across the whole week. You can hover over each day to see what your total was for the day, and how much of your average the total was.
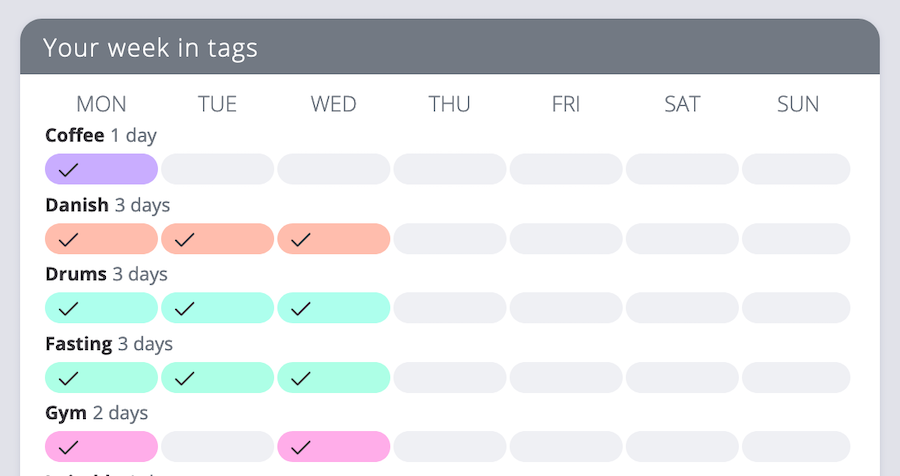
You'll also see a graph of your tags for the week, showing which days each tag was used:
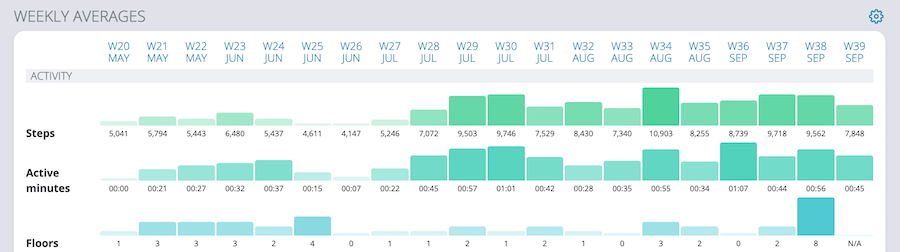
And if you scroll down you'll see your mood ratings and notes for each day of the week. Finally, there's a graph at the bottom of this page of all your attributes. This one shows your average daily value for each attribute per week, so you can get a longer-term view of how your data has changed over time. While we often use rolling averages throughout Exist to smooth out big, short-term changes in your data, these averages only use your data for each particular week:
As with day view, you can use the arrows to jump between weeks, or you can adjust the URL to jump to a particular date. Week view has URLs that are formatted like this:
https://exist.io/dashboard/2019-w28/
And you can always click the double arrow to jump back to the current week:
Month view
Finally, click on "Month" and let's look at what you can do on the month view.
This page has bars for some of your attributes, just like the week view, except these show your total for the month compared to your average.
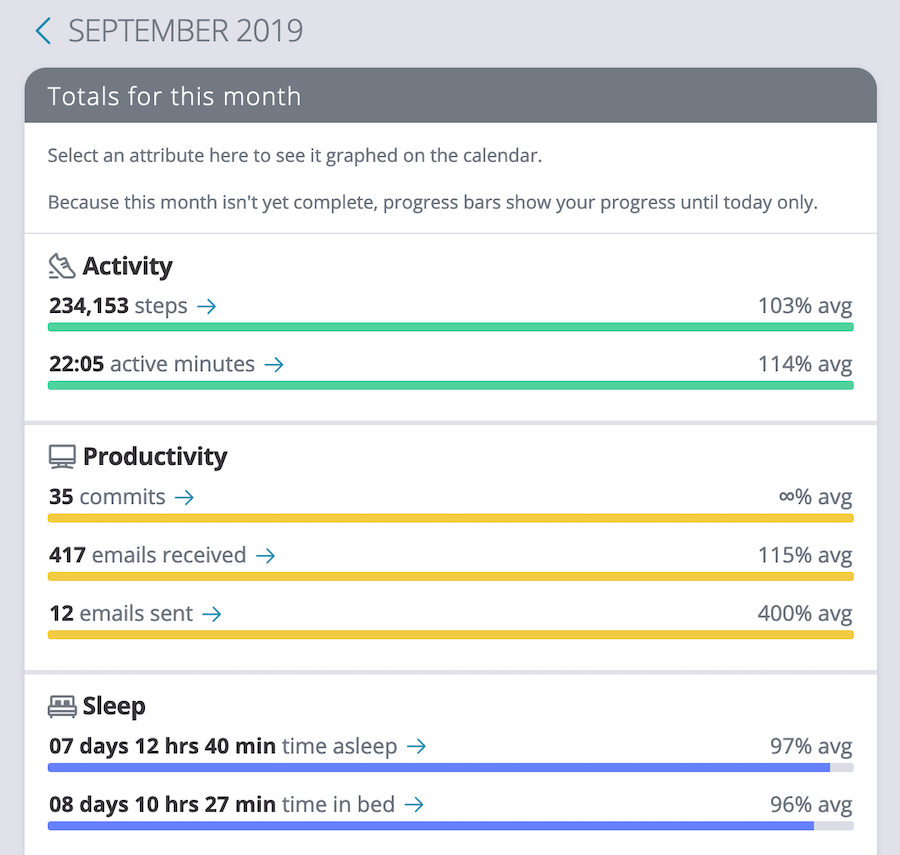
The month view also has a calendar, where you can see the data for these attributes per day. Each day will also show a coloured circle matching your mood rating if you've rated that day. Click the arrow next to any attribute to load that attribute's data into the calendar:
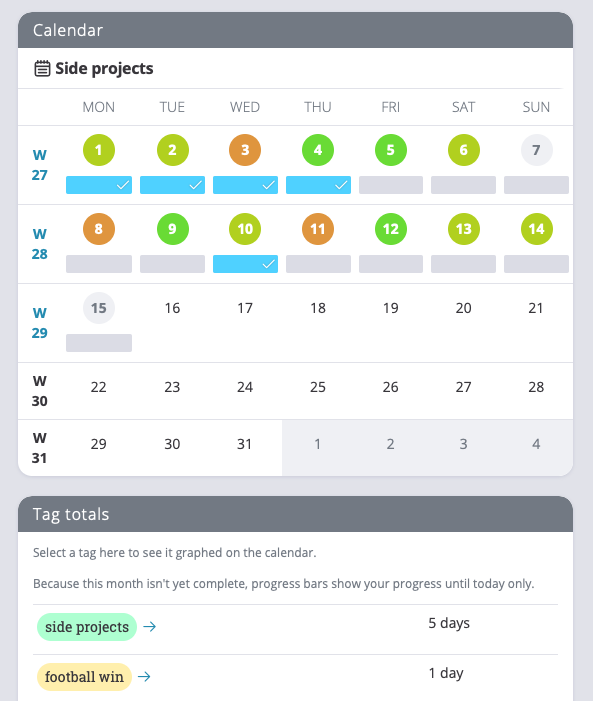
You can also use this calendar to jump from to a particular week or day by clicking on the week numbers or the individual days.
There's also a card for tags, showing how many times you used each tag for the month. Tags also have arrows, so you can click on any of these to show them on the calendar and see which days you used the tag.
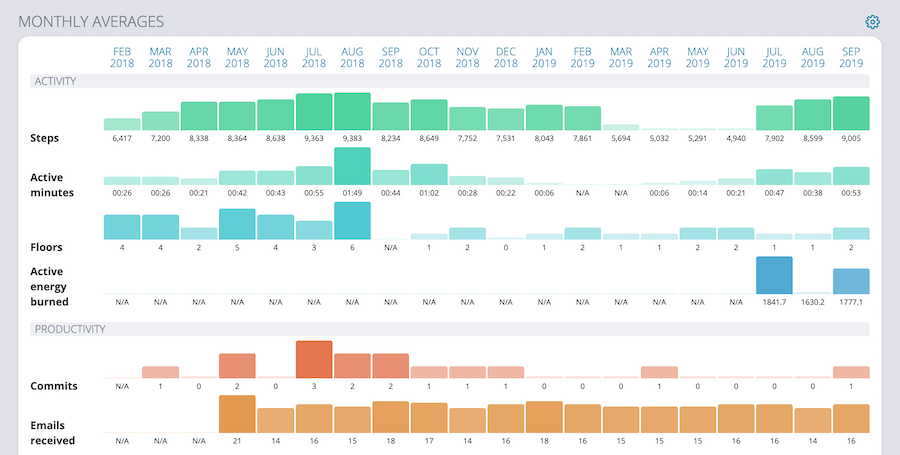
And of course we finish this page off with another graph. This one shows your average daily value for each month, so you can easily see a year or more of your data at once. It's great for seeing the bigger picture and catching any changing trends in your data long-term:
The month view has the same arrow controls for browsing previous months, and you can adjust the URL to jump to a particular month if you prefer. The URLs are formatted like this:
https://exist.io/dashboard/2019-6/
In another post we'll look at our new trends pages and other ways to explore the meaning behind all this data. But if you just want to browse your data to see what the numbers are, these historical browsing options should provide the views you need.